Introduction
This is the manual for the MCDA user interface for benefit-risk analysis. It starts with instructions about creating a workspace (based on a dataset), followed by a brief introduction to benefit-risk analysis based on the ADDIS MCDA user interface, followed by a more thorough theoretical discussion of the analytical methods.
💡 A guided tutorial is also available here.
Throughout this manual we also mention features only available in the Enterprise edition of ADDIS/MCDA (see here). These features are marked with a bar on the left of the paragraphs, like so:
Marked enterprise features.
Preparing your dataset
This section only applies to the stand-alone version of MCDA, hosted on https://mcda.drugis.org/. In ADDIS (https://addis.drugis.org/), this step is not necessary.
After signing in to MCDA, you are on your personal home page. It contains a list of your previously-created workspaces (which will be empty until you create one). Any unfinished workspaces in the process of manual entry will also be shown here. A workspace is an abstract container for a set of evidence, plus any filterings, preference elicitations and analyses you may have performed based on that set of evidence. Clicking the 'Create workspace' button will open a dialog that lets you choose what to base your workspace on: an example dataset selected by us, a file uploaded by you, or manual entry by you.
Data upload
Datasets can be uploaded in JSON format, and must follow our JSON schema, with the `schemaversion` property indicating which version of the schema the file follows. A list of examples is available on the MCDA repository.
Manual entry
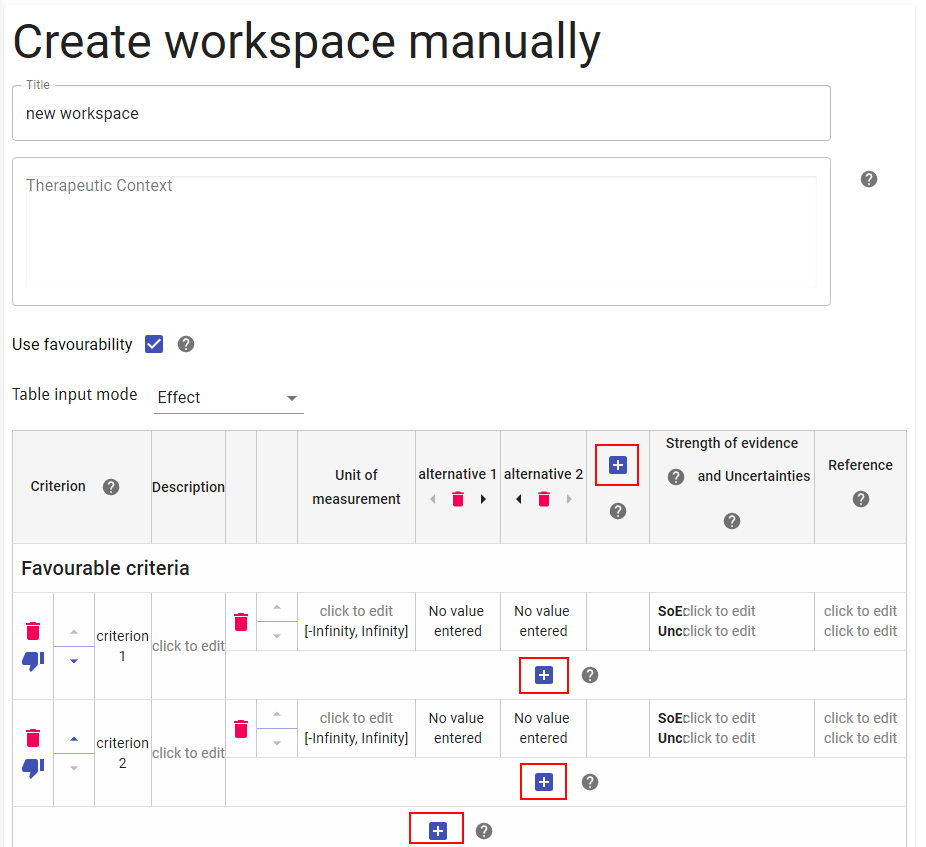
Selecting the 'Manual entry' option in the workspace creation dialog takes you to the manual workspace creation screen. Here, you can input the title, therapeutic context, criteria, and alternatives as well as the measurement data that you wish to use in your analyses.
The layout of the manual entry interface mirrors that of the Effects Table as required by the EMA in the PrOACT-URL framework. You can toggle whether you wish to separate the criteria into favourable and unfavourable ones. You can add alternatives, criteria and data sources by clicking the '+' button in the appropriate place. When creating a criterion, one data source is automatically created for it. All text elements such as criteria and alternative names can be edited by clicking on them. The same goes for data cells, which are automatically created as the table size changes with the addition or deletion of alternatives, criteria and data sources.
Measurement data can be entered either as effects (e.g. point estimates, confidence intervals or ranges) or as distributions (e.g. normal, Beta, Gamma). The effects will be used in deterministic analysis, whereas distributions will be used in stochastic analysis (SMAA). After entering effects data, it is possible to have the system automatically create distributions based on the effects by clicking the 'Generate Distributions' button at the bottom of the page.
A unit of measurement can be specified for each criterion. The default unit of measurement is unbounded (i.e. values can range from negative to positive infinity). Besides this, percentages ([0-100] and decimal values [0, 1]) are supported. If one of the latter two units is chosen, entered effects must lie within this corresponding interval, otherwise an error will be shown.
Any changes you make are automatically saved. You can click this in-progress workspace from your personal homepage later, and continue where you left off.
Once you are satisfied with your data table, you can click the 'Done' button and proceed with your MCDA process based on this data.